Performance Highlights March 2020
-
Industry Snapshot:
The Australian private equity and venture capital (PE/VC) industry
remains significant, with $30 billion of capital raised to date. In the
first quarter of 2020, the industry continued to deploy capital into
Australian and New Zealand companies and distribute capital back to
investors. In aggregate over the 12-month period ending March 2020, the
industry invested $1.2 billion and distributed more than $1.2 billion,
net of fees, back to investors.
-
Strong Long-term Performance:
Australian PE/VC demonstrated strong long-term net of fees performance
for investors, with an uplift in outperformance versus the ASX 300 and
the ASX Small Ordinaries Index for the 5, 10, and 20-year periods
ending 31 March 2020 – tracking between +6.3% and +11.5% ahead of the
listed market. Long-term performance of the local market remains
broadly in-line with global peers over time.
-
Early Impacts of COVID-19:
Australian PE/VC market held-up well during the initial days of the
COVID-19 pandemic (as measured through 31 March 2020) relative to both
listed markets and global peers. PE/VC performance during this period
protected investor capital in a meaningful way. Over the one-year
ending March 2020, performance lagged global peers, primarily due to
market-specific factors, including a lower allocation to information
technology in the Australian PE/VC market.
Industry Snapshot
The Australian PE/VC index represents a well-established industry and a
significant pool of capital and net of fees strong distributions to
investors. At the end of Q1 2020, the Cambridge Associates Australian PE/VC
Index represented $29.4 billion of capital raised by 108 PE/VC funds. Over
the 20-year period of data captured by the Index, the industry has invested
$24.3 billion (+$596 million in Q1 2020) in Australian and New Zealand
companies, returning $27.6 billion (+$108 million in Q1 2020) net of fees
back to investors and still holding unrealised investments valued at $9.0
billion (-$116 million in Q1 2020). This universe is historically dominated
by buyout and growth equity strategies, representing 93% of total
capitalization, while venture capital funds represent 7% of the index by
capitalization. In the first quarter of 2020, buyout and growth equity
funds provided 61% of distributions to investors, while venture capital
funds accounted for 39% of distributions during the period. By net asset
value as at first quarter 2020, buyout and growth equity accounted for 83%
of the index, and with 17% in venture capital.
Over the one-year ending March 2020, the industry invested $1.2 billion
into Australian and New Zealand companies, in line with prior years, which
have averaged $1.3 billion per year (since 2009). Investors received net of
fees distributions of $1.2 billion from Australian PE/VC managers over the
one-year period, lower than the average $2.3 billion per year since 2016.
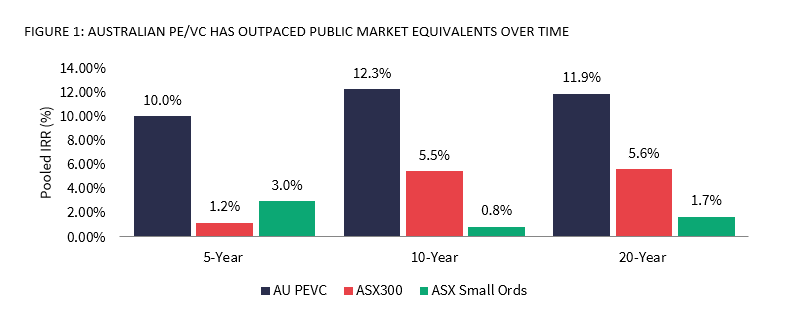
Long-Term Performance Remains Strong
As of end March 2020, the initial impacts of COVID-19 were only beginning
to be reflected in performance data. Over the long term, Australian PE and
VC returns showed continued strong long-term performance, delivering double
digit net of fees returns over 5-, 10-, and 20-year periods (Figure 1).
Over these same periods, Australian PE/VC managers in aggregate
demonstrated robust outperformance over the listed markets, outpacing the
ASX 300 Index by +6.3% to +8.8% and the ASX Small Ordinaries Indices by
+7.0% to +11.5% on a public market equivalent (mPME) basis. To measure
mPME, Cambridge Associates compares private equity performance to that of
listed equities by hypothetically ‘investing’ in the ASX 300 and the ASX
Small Ordinaries at the same time and equivalent amount as the private
equity investments. While it is generally accepted that the higher risk and
illiquidity of private equity require it to generate returns of +3% to +5%
over listed markets over time, the local PE and VC industry surpasses this
standard hurdle. It has also benefited from limited downside movement
versus listed markets in the recent quarter and over time.
Source: Cambridge Associates Database, 31 March 2020, net of fees, expenses and carried interest. Returns presented in Australian Dollar terms.
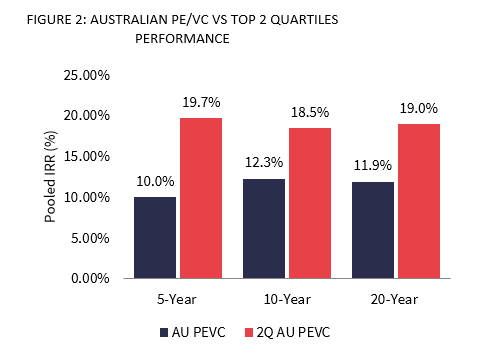
Manager selection and the ability to access top performing managers
provided even greater absolute return net of fees and relative to the
listed markets. In the data gathered by Cambridge Associates, the top two
quartiles of Australian PE/VC funds have delivered 18%+ annualised returns
over 5-, 10-, and 20-year periods ending 31 March 2020 (19.7%, 18.5%, and
19.0% respectively net of fees and carried interest, see Figure 2). This
universe exceeds returns of the broad Australian PE/VC industry by +6.5% to
+11.7% per annum over time, while also outperforming the ASX 300 Index by
+13.8% to +18.4% and the ASX Small Ordinaries Index by +16.7% to +18.0% on
a public market equivalent (mPME) basis.
Source: Cambridge Associates Database, 31 March 2020, net of fees, expenses and carried interest. Returns presented in Australian Dollar terms.
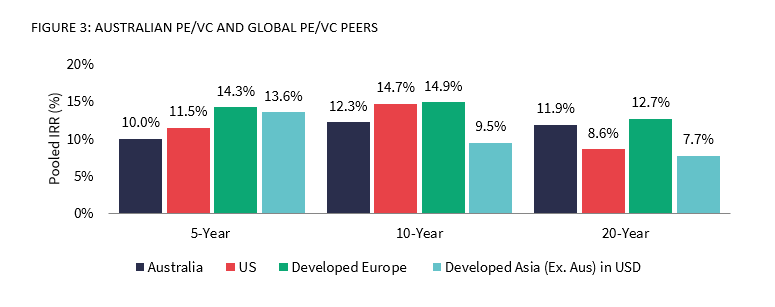
Australian PE/VC performance remains competitive among global peers over
time. On a local currency basis, with each region measured in its base
currency unless noted otherwise, Australian PE/VC returns exceed US and
Asian PE/VC peers and lag European PE/VC over 20 years (Figure 3). Over 5-
and 10-year periods, Australian performance lags global PE/VC, reflecting
local market factors including interest rates, valuations and in some
instances market depth and the impact of sector exposures.
Source: Cambridge Associates Database, 31 March 2020, net of fees, expenses and carried interest. Returns presented in local currency terms.
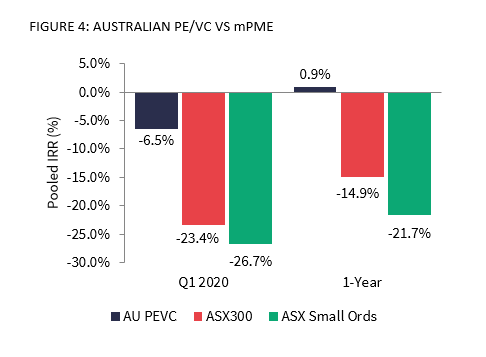
Early Impacts of COVID-19
Just as COVID-19 has had an extraordinary impact on the lives and
livelihoods of Australian citizens, so too has it impacted financial
markets. Public markets felt the impact of COVID-19 in the first quarter,
reaching lows in mid-to-late March. Over this time, the Cambridge
Associates Australian PE/VC Index declined by -6.5%, a limited downside for
investors relative to listed markets during the quarter. The Australian
PE/VC industry performance bested listed markets (Figure 4) by nearly 17%,
and 16% for the first quarter and one-year ending March 2020, respectively.
A quarterly return of -6.5% for Australian PE/VC represents the largest
negative quarterly return for the industry since December 2008, and one of
six quarters with a negative return during that 45-quarter period. For the
12 months ending 31 March 2020, the Australian PE/VC industry outpaced the
ASX 300 Index and the ASX Small Ordinaries Index by +15.8% and +22.6%
respectively.
Source: Cambridge Associates Database, 31 March 2020, net of fees, expenses and carried interest. Returns presented in Australian Dollar terms.
While it is useful to measuring the industry cash flows over a quarterly or
12-month period to provide a snapshot of the recent market volatility, this
periodicity does not provide a meaningful performance indicator for a
long-term asset class. Private equity and venture capital performance is
measured over the medium to long-term (5- to 20-year periods) to align
performance with the strategy of acquiring and divesting investment assets.
Australian PE/VC performed in line with global developed PE/VC markets, in
local currency terms during the first quarter (Figure 5). However,
Australian PE/VC lagged global peers over 1-year ending March 2020, similar
to the 5- and 10- year periods referenced above. In the one-year period,
Australian PE/VC had significantly lower allocations to Information
Technology relative to global peers which benefitted from the sectors
strong performance.
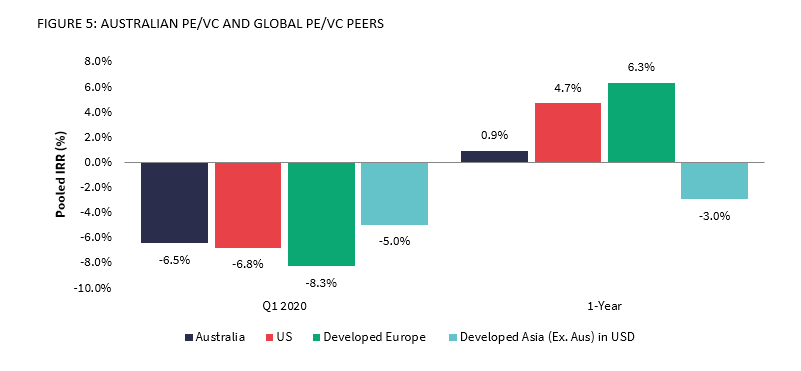
Source: Cambridge Associates Database, 31 March 2020, net of fees, expenses and carried interest. Returns presented in local currency terms.
Since its inception, over 80% of returns from the industry have been driven
by investments in four sectors: consumer, industrials, healthcare, and IT.
While the ASX 300 has been dominated by financials and materials, private
equity has offered investors differentiated sector exposure and investments
outside publicly listed companies. At the end of March 2020, the Australian
PE/VC index continued to be dominated by the four key sectors noted below
(Figure 6).
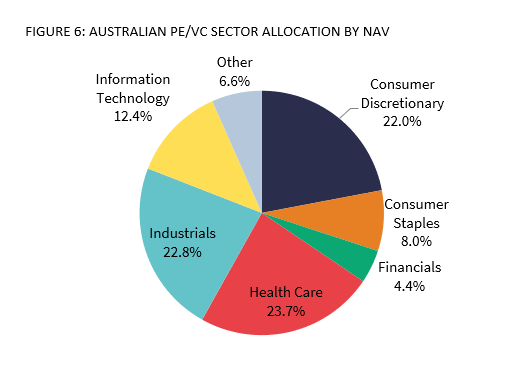
Source: Cambridge Associates Database, 31 March 2020.
The -6.5% first quarter return of the Australian PE/VC index incorporates
the quarterly movements of key sector allocations (Figure 7). Consumer
discretionary and financials saw a significant impact on valuation in the
early stages of the consumer crisis, with healthcare impacted by initial
COVID-19 lockdowns. Downside during the quarter was mitigated by
performance of industrials and IT. Over the long-term (10-year), these key
sectors added value to the PE/VC index performance.
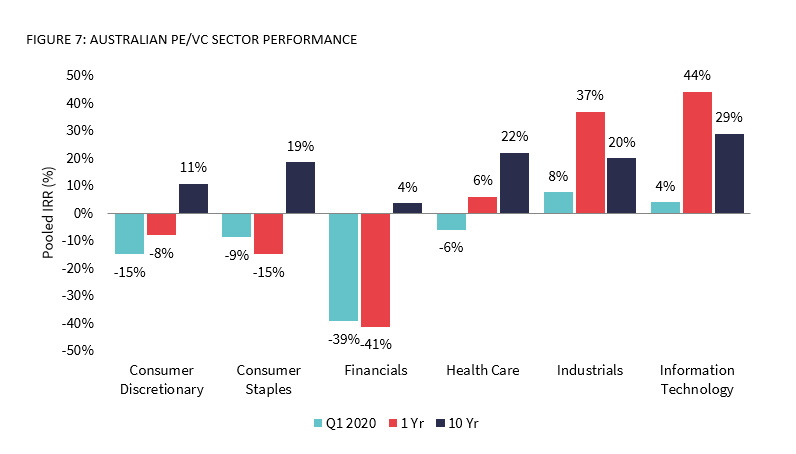
Source: Cambridge Associates Database, 31 March 2020, net of fees, expenses and carried interest. Returns presented in Australian Dollar terms.
Australian PE/VC Looking Ahead
PE and VC managers were quick to respond, intensively and actively working
with their portfolio companies to dampen the initial impacts of the global
pandemic and access available support from governments and banks. However,
the net effect of these industry efforts in aggregate will only build over
time with ongoing performance data. As additional data builds via the
Australian PE/VC Index, Cambridge Associates will continue to measure the
PE/VC industry and reflect on the impacts to valuation, distributions and
investments in Australia and New Zealand.