Performance Highlights September 2020
-
Industry Snapshot:
The Australian private equity and venture capital (PE/VC) industry is
significant, with $30 billion of capital raised to date. Year to date
2020, the industry continued to deploy capital into Australian and New
Zealand companies and distribute capital back to investors. In
aggregate over the 12-month period ending September 2020, the industry
invested $1.4 billion and distributed more than $1.1 billion, net of
fees, back to investors.
-
Strong Long-term Performance:
Australian PE/VC continues to demonstrate strong long-term net of fees
performance for investors, outpacing the ASX 300 and the ASX Small
Ordinaries for the 5, 10, and 20-year periods ending 30 September 2020
– tracking between +0.2% and +9.5% ahead of the listed markets.
Long-term performance of the local market (over 20 years) remained
ahead of global peers, while mid-term performance (over 5 and 10 years)
lagged due to individual market factors.
-
PE/VC amid COVID-19:
Australian PE/VC performance held-up well for the year to date (as
measured through 30 September 2020), besting listed markets over this
period. Among global peers, Australian PE/VC was in line with Developed
Europe but lagged strong returns from US PE/VC. Over the one-year
ending September 2020, Australian PE/VC performance was strong but
lagged global peers, primarily due to market-specific factors,
including a lower relative allocation to Information Technology in the
Australian PE/VC market.
Industry Snapshot
The Australian PE/VC index represents a well-established industry with a
significant pool of capital and strong net of fees distributions to
investors. At the end of Q3 2020, the Cambridge Associates Australian PE/VC
Index represented $29.4 billion of capital raised by 108 PE/VC funds. Over
the 20-year period of data captured by the Index, the industry has invested
$24.9 billion (+$1.2 billion year to date 2020) in Australian and New
Zealand companies, returning $28.3 billion (+$880 million year to date
2020) net of fees back to investors and holding unrealised investments
valued at $9.7 billion (+$636 million year to date 2020). This universe is
historically dominated by buyout and growth equity strategies, representing
93% of total capitalization, while venture capital funds represent 7% of
the index by capitalization. In the third quarter of 2020, buyout and
growth equity funds provided nearly 90% of the distributions to investors,
with venture capital representing close to 10% of distributions. By net
asset value as at 30 September 2020, buyout and growth equity accounted for
81% of the index, with 19% in venture capital.
Over the one-year ending September 2020, the industry invested $1.0 billion
into Australian and New Zealand companies, slightly below capital deployed
in prior years, which have averaged $1.3 billion per year (since 2009).
Investors received net of fees distributions of $1.1 billion from
Australian PE/VC managers over the one-year period, lower than the average
$2.3 billion per year since 2016.
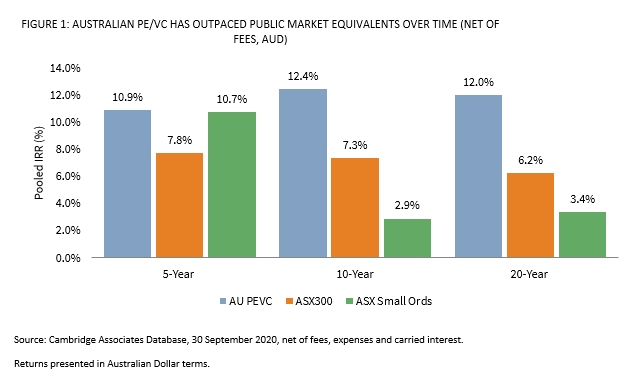
Long-Term Performance Remains Strong
Over the long term, Australian PE and VC returns showed continued strong
long-term performance, delivering double digit net of fees returns over 5-,
10-, and 20-year periods (Figure 1). Over these same periods, Australian
PE/VC managers in aggregate demonstrated robust outperformance over the
listed markets, outpacing the ASX 300 Index by +3.1% to +5.8% and the ASX
Small Ordinaries Index by +0.2% to +9.5% on a public market equivalent
(mPME) basis. To measure mPME, Cambridge Associates compared private equity
performance to that of listed equities by hypothetically ‘investing’ in the
ASX 300 and the ASX Small Ordinaries at the same time and equivalent amount
as the private equity investments. While it is generally accepted that the
higher risk and illiquidity of private equity require it to generate
returns of +3% to +5% over listed markets over time, the local PE and VC
index has largely achieved this standard hurdle across periods.
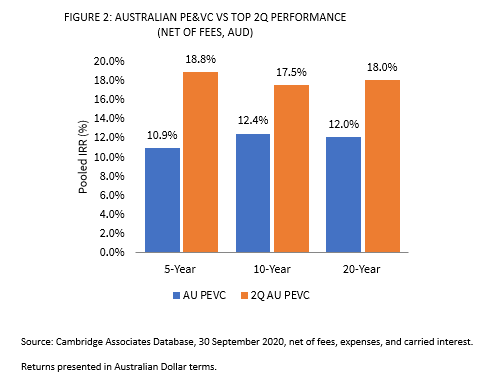
Manager selection and the ability to access top performing managers
provided even greater absolute returns net of fees and relative to the
listed markets. In the data gathered by Cambridge Associates, the top two
quartiles of Australian PE/VC funds have delivered 17%+ annualized returns
over 5-, 10-, and 20-year periods ending 30 September 2020. This universe
exceeded returns of the broad Australian PE/VC industry by +5.1% to +7.9%
per annum over time, while also outperforming the ASX 300 Index by +10.2%
to +11.8% and the ASX Small Ordinaries Index by +8.1% to +14.6% on a public
market equivalent (mPME) basis.
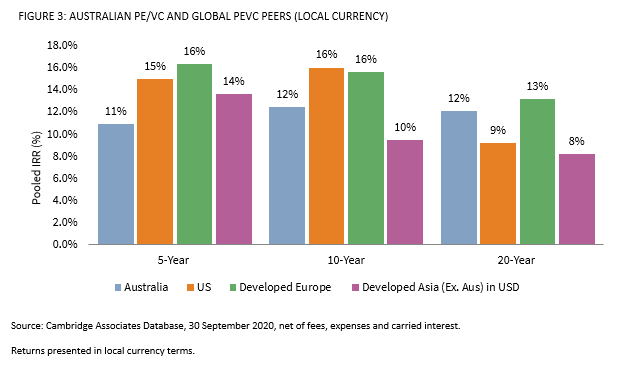
Australian PE/VC performance remains competitive among global peers over
time. On a local currency basis, with each region measured in its base
currency unless noted otherwise, Australian PE/VC returns exceeded US and
Asian PE/VC peers but lagged European PE/VC over 20 years (Figure 3). Over
5- and 10-year periods, Australian performance lagged global PE/VC,
reflecting local market factors including interest rates, valuations,
market depth and sector exposures.
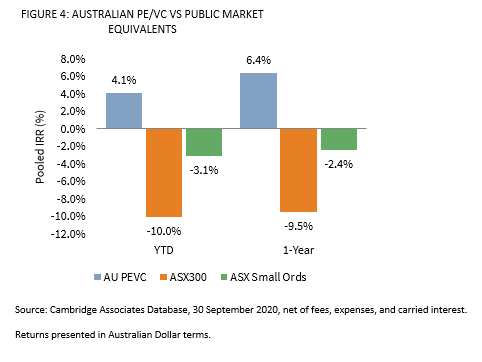
Australian PE/VC as COVID Continues
The Australian PE/VC Index was up 4.1% for the year to date through 30
September 2020, and it continued to best the mPME of public indices by
+14.1% (ASX 300) and +7.2% (ASX Small Ords) for the period (Figure 4). The
third quarter (ending 30 September 2020) saw a slowdown in the recovery of
listed markets while the rebound in performance of the Australian PE/VC
index persisted through the period (+7.3%). The compounding effect of lower
volatility from the PE/VC index contributed to the aggregate outperformance
versus listed peers for the year to date. For the 12 months ending 30
September 2020, the Australian PE/VC industry outpaced the ASX 300 Index
and the ASX Small Ordinaries Index by +15.9% and +8.8% respectively.
While it is useful to measure the industry’s cash flows over a quarterly or
12-month period to provide a snapshot of the recent market volatility, this
periodicity does not provide a meaningful performance indicator for a
long-term asset class. Private equity and venture capital performance is
measured over the medium to long-term (5- to 20-year periods) to align
performance with the strategy of acquiring and divesting investment assets.
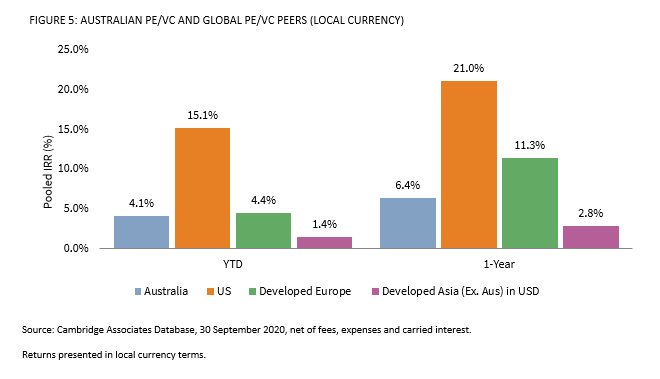
In line with global developed PE/VC peers, Australian PE/VC performance
continued to recover and has turned positive for the year to date (through
30 September 2020), though return dispersion across regions contributed to
varying results across regions for the period. Strong performance from US
PE/VC resulted in its outperformance versus global peers (including
Australia), in local currency terms (Figure 5). Australian PE/VC lagged
global peers over the past year ending September 2020, similar to the 5-
and 10- year periods referenced above. In the 1-year period, Australian
PE/VC had significantly lower allocations to Information Technology
relative to global peers which benefitted from the sector’s strong
performance.
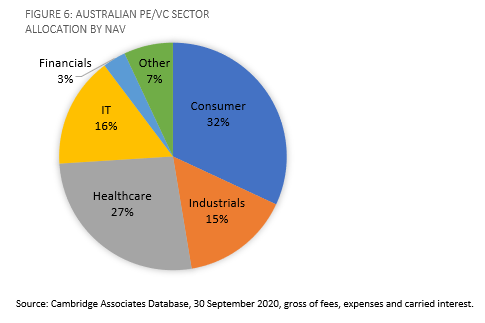
As of 30 September 2020, the Australian PE/VC index continued to be
dominated by four key sectors: Consumer, Healthcare, IT and Industrials
(Figure 6). For the year to date 2020, the Australian PE/VC Index invested
capital into Industrials, Communication Services, Healthcare, Consumer and
IT companies and realizations came from companies in the Industrials,
Healthcare and Consumer sectors.
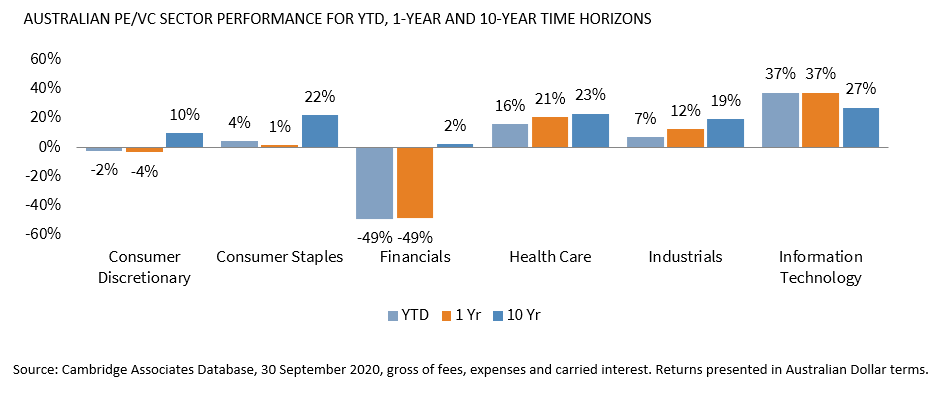
In the early days of COVID-19, Australian PE/VC Index sector “winners”
included: IT, Industrials and Healthcare (Figure 7), which all contributed
positive returns for the year to date. The Consumer Discretionary and
Financials sectors detracted during the period and amid the height of the
initial lockdown restrictions. Global PE/VC peers saw similar “winners” in
offshore markets during this period, including positive contributions from
IT, Healthcare, Industrials and Consumer Staples. While this year to date
view provides a reference to PE/VC performance during the pandemic, it is a
very short time frame of data for strategies that typically manage
investments with a three- to seven-year holding period.
Australian PE/VC Looking Ahead
Following the initial focus on liquidity and stabilization of portfolio
companies during the onset of the pandemic, PE and VC managers are now
increasingly revisiting investment and fundraising plans as they adjust to
the current market environment and navigate new norms. Beginning to play
out more clearly is a dispersion of impact to sectors and companies as a
result of the pandemic. Tourism and retail facing businesses were
disproportionately affected by border closures and lockdowns, for these
sectors timeframe for expected exit has been extended by +6 to +18 months,
while exits are being pushed forward in sectors and companies that are
experiencing accelerated growth from the push to digitalization and other
related trends. PE and VC are expected to continue to play a portfolio role
of dampening volatility relative to listed markets, while positioning
companies for and providing investors with long-term growth opportunities.
This is coupled with the investment opportunity going forward for PE and VC
managers as markets reopen and M&A returns. As additional data builds
via the Australian PE/VC Index, Cambridge Associates will continue to
measure the PE/VC industry and reflect on the impacts to valuation,
distributions and investments in Australia and New Zealand.