Performance Highlights March 2021
-
Industry Snapshot:
The Australian private equity and venture capital (PE/VC) industry is
significant, with $30.3 billion of capital raised to date. In 1Q21, the
industry continued to deploy capital into Australian and New Zealand
companies and distribute capital back to investors. In aggregate over
the 3-month period ending March 2021, the industry invested over $200
million and distributed more than $400 million, net of fees, back to
investors, while the value of unrealized investments increased by over
$600 million.
-
Strong Long-term Performance:
Australian PE/VC continues to demonstrate strong long-term net of fees
performance for investors, outpacing the ASX 300 and the ASX Small
Ordinaries for the 5, 10, and 20-year periods ending 31 March
2021 - tracking between +3.8% and +11.2% ahead of the listed markets.
Long-term performance of the local market (over 20 years) remained
ahead of global peers, while mid-term performance (over 5 years)
lagged.
-
PE/VC COVID-19 Recovery:
Australian PE/VC performed strongly over the trailing 1-year period
rebounding from the peak of the pandemic. Australian PE/VC outperformed
the ASX 300 benchmark but lagged the ASX Small Ordinaries over this
period. However, over the first quarter of 2021, Australian PE/VC
bested both listed benchmarks, showing continued strong momentum. Among
global peers, Australian PE/VC outpaced Developed Asia but lagged US
and Europe over the trailing 1-year period.
Industry Snapshot
The Australian PE/VC index represents a well-established asset class that
has invested significant capital for LPs and returned strong net
distributions. At the conclusion of Q1 2021, the Cambridge Associates
Australian PE/VC Index represented $30.3 billion raised by 109 PE/VC funds.
Over the 20-year period of data captured by the index, the industry has
invested $25.8 billion (+$200 million in 1Q21) in Australian and New
Zealand companies, returning $29.6 billion (+$400 million in 1Q21) net of
fees back to investors and holding unrealized investments valued at $11.8
billion (+$600 million in 1Q21). The universe is historically dominated by
buyout and growth equity strategies, representing 93% of total
capitalization, while venture capital funds represent 7% of the index.
Historically buyout and growth equity funds provided nearly 95% of the
distributions to investors, with venture capital representing close to 5%
of distributions. By net asset value as at 31 March 2021, buyout and growth
equity accounted for 77% of the index, with 23% in venture capital.
The Australian Private Credit market remains young relative to the US or
Europe but has been developing well. Fundraising activities have increased
in recent years, driven by the appetite from Australian businesses for
bespoke financing solutions, especially within the middle market where the
smaller cheque size and higher cost of business have historically been less
appealing to traditional banking institutions. With low interest rates
across the world, listed fixed income assets are expensive but are likely
to remain so for the near term as global interest rates and monetary
policies are expected to remain accommodative. However, with the successful
containment of COVID-19 in New Zealand, the RBNZ has indicated possible
near-term interest rate rises as early as August 2021. That said, Private
Credit should remain attractive to investors as it continues to offer
stronger yields relative to listed bonds, as well as defensive attributes
such as floating rate exposure should inflation and interest rates move
higher.
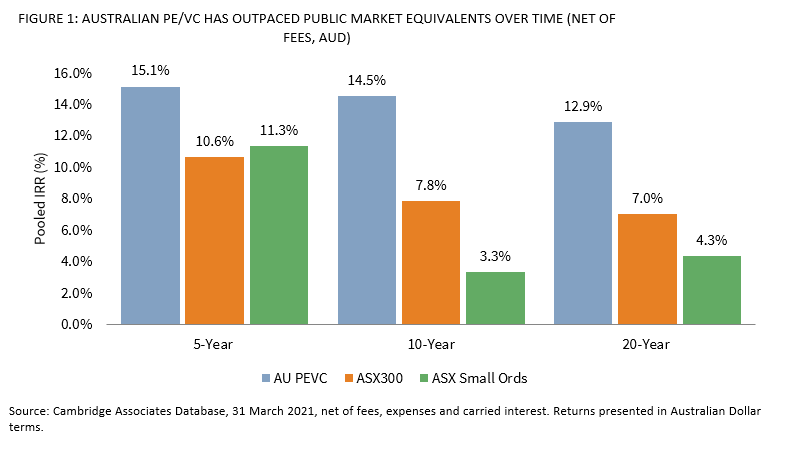
Long-Term Performance Remains Strong
Over longer periods, Australian PE and VC returns showed continued strong
long-term performance, delivering double digit net of fees returns over 5-,
10-, and 20-year periods (Figure 1). Over these same periods, Australian
PE/VC managers in aggregate demonstrated robust outperformance over the
listed markets, outpacing the ASX 300 Index by +4.5% to +6.7% and the ASX
Small Ordinaries Index by +3.8% to +11.2% on a public market equivalent
(mPME) basis. To measure mPME, Cambridge Associates compared private equity
performance to that of listed equities by hypothetically ‘investing’ in the
ASX 300 and the ASX Small Ordinaries at the same time and equivalent amount
as the private equity investments. While it is generally accepted that the
higher risk and illiquidity of private equity require it to generate
returns of +3% to +5% over listed markets over time, the local PE and VC
index has largely achieved this standard hurdle across periods.
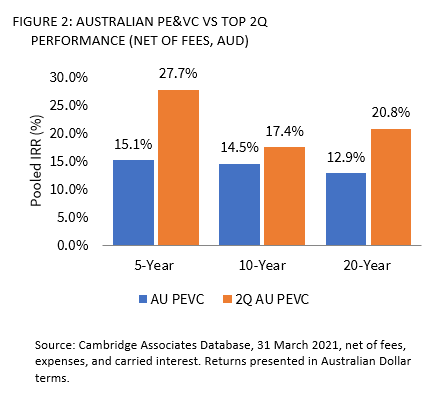
Manager selection and the ability to access top performing managers
provided higher absolute returns net of fees and relative to the listed
markets. In the data gathered by Cambridge Associates, the top two
quartiles of Australian PE/VC funds have delivered 17% to 28% annualized
returns over 5-, 10-, and 20-year periods ending 31 March 2021. This
universe exceeded returns of the broad Australian PE/VC industry by +2.9%
to +12.6% per annum over time, while also outperforming the ASX 300 Index
by +9.6% to +17.1% and the ASX Small Ordinaries Index by +14.1% to +16.5%
on a public market equivalent (mPME) basis.
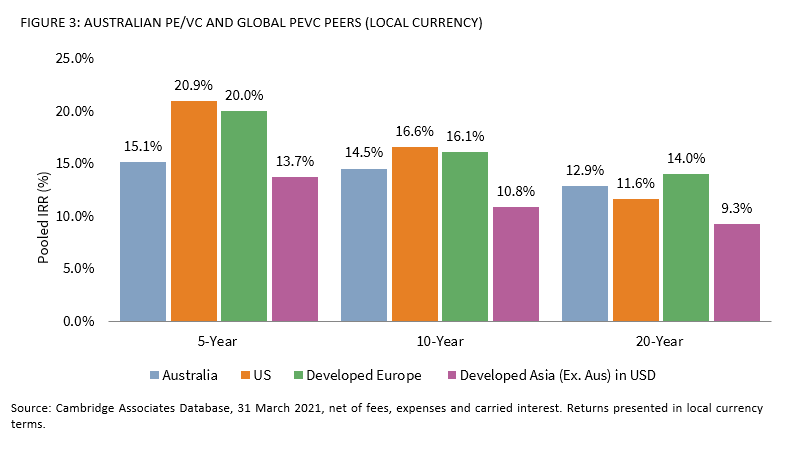
Australian PE/VC performance remains competitive among global peers over
time. On a local currency basis, with each region measured in its base
currency unless noted otherwise, Australian PE/VC returns exceeded US and
Asian PE/VC peers but lagged European PE/VC over the 20-year period (Figure
3). Over 5- and 10-year periods, Australian performance lagged US and
European PE/VC while outperforming Developed Asia PE/VC, reflecting local
market factors including interest rates, valuations, market depth and
sector exposures.
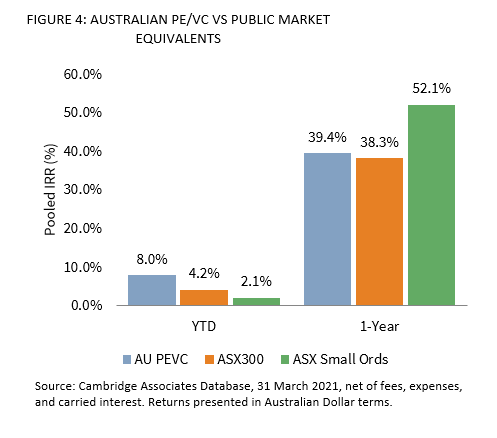
Australian PE/VC as COVID Continues
The Australian PE/VC Index was up 39.4% over the trailing 1-year period to
31 March 2021, outperforming the ASX 300 by 1.1% while underperforming the
ASX Small Ordinaries by 12.6% (Figure 4). The strong 1-year performance of
the Small Ordinaries Index was driven in part by the larger drawdown
experienced in 1Q20 and subsequent market recovery over the past year,
which helped amplified returns. The first quarter (ending 31 March 2021)
saw a slight deceleration in the recovery of listed markets, while the
Australian PE/VC index (+8.0%) continued its upward momentum. It is
important to note that Australian PE/VC returned -6.5% in 1Q20 compared to
-23.4% and -26.7% for the ASX 300 and ASX Small Ordinaries respectively,
which demonstrates the degree of downside protection provided by private
investments during the onset of the pandemic last year and adds contexts to
the relative outperformance of public markets for the 1-year period
mentioned below.
While it is useful to measure the industry’s cash flows over a quarterly or
12-month period to provide a snapshot of the recent market volatility, this
periodicity does not provide a meaningful performance indicator for a
long-term asset class. Private equity and venture capital performance is
measured over the medium to long-term (5- to 20-year periods) to align
performance with the strategy of acquiring and divesting investment assets.
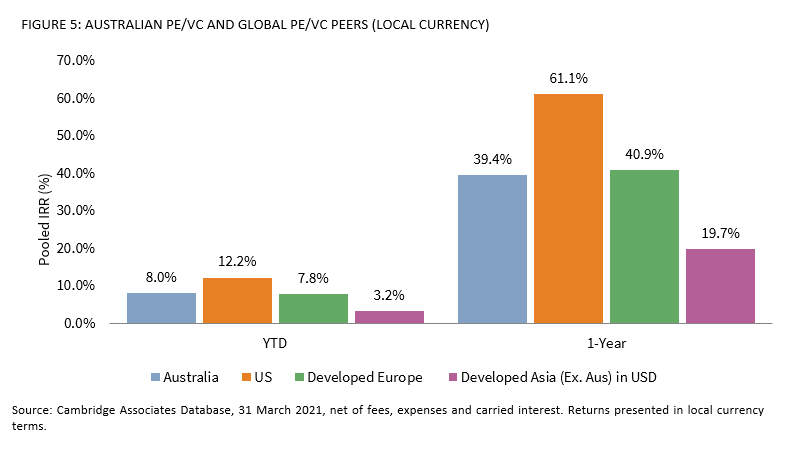
In line with global developed PE/VC peers, Australian PE/VC performance
remained robust throughout the year, though return dispersion across
regions contributed to varying results across regions for the period.
Strong performance from US PE/VC resulted in its outperformance versus
global peers (including Australia), in local currency terms (Figure 5).
Australian PE/VC bested Asian counterparts and were broadly in line with
Europe PE/VC in 2020 showing the relative strength of Australian businesses
and economy, largely due to the milder pandemic impact experienced. For the
1-year period, Australian PE/VC had meaningfully lower allocations to
Information Technology relative to the US which benefitted from the
sector’s strong performance.
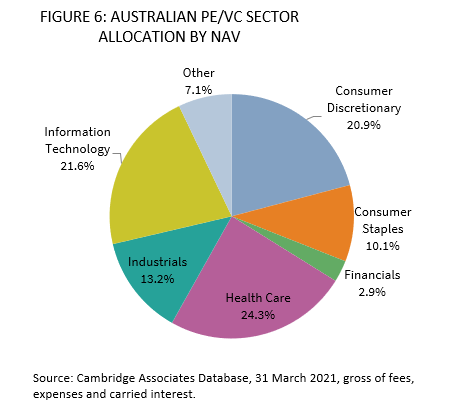
As of 31 March 2021, the Australian PE/VC index continued to be dominated
by four key sectors: Consumer, Healthcare, IT and Industrials (Figure 6).
In 1Q21, the Australian PE/VC Index invested capital into Industrials,
Communication Services, Healthcare, Consumer and IT companies and
realizations came from companies in the Industrials, Healthcare and
Consumer sectors.
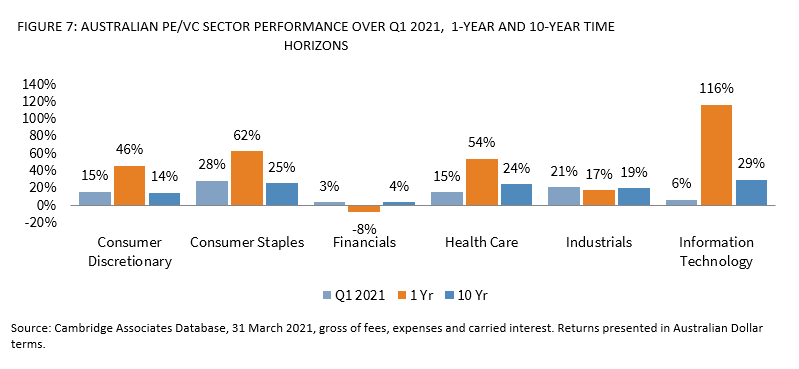
Australian PE/VC Index sector “winners” for the 1-year period ending 31
March included: IT, Consumer Staples and Healthcare (Figure 7), which all
contributed positive returns for the full year. Financials have continued
to detract from performance while all other sectors have recovered from the
COVID-19 induced lows. In Q1 2021, IT and Financials lagged other asset
classes, while Industrials and Consumer Staples have shown the strongest
performance. While this year-to-date view provides a reference to PE/VC
performance during the period, it is a very short time frame of data for
strategies that typically manage investments with a three- to seven-year
holding period.
Australian PE/VC Looking Ahead
While the impact of the recent lockdown restrictions in NSW and around the
country are likely to weigh on Australia’s economic recovery, and by
extension financial performance across public and private assets,
expansionary fiscal and monetary policies as well as the availability of
vaccines, should continue to provide support and allow for the resumption
of growth once the economy reemerges from the COVID-19 pandemic. On the
other hand, New Zealand, with its success in containing the COVID-19 virus,
has continued to demonstrate robust economic growth and the RBNZ has
signaled that it is preparing for the transition to less accommodative
policies. Having navigated the 2020 lockdowns, Australian GPs are generally
more optimistic heading into the country’s current mobility restrictions,
and are leaning on the experience, data and playbooks developed last year
to manage their portfolio companies. The immediate effect of the ongoing
lockdowns will vary by industry and the long-term impact of the pandemic to
consumer preferences and investment trends in aggregate will build over
time with ongoing performance data. As additional data builds via the
Australian PE/VC Index, Cambridge Associates will continue to measure the
PE/VC industry and reflect on the impacts to valuation, distributions and
investments in Australia and New Zealand.