Performance Highlights December 2020
-
Industry Snapshot:
The Australian private equity and venture capital (PE/VC) industry is
significant, with $30.3 billion of capital raised to date. In 2020, the
industry continued to deploy capital into Australian and New Zealand
companies and distribute capital back to investors. In aggregate over the
12-month period ending December 2020, the industry invested $1.9 billion
and distributed more than $1.7 billion, net of fees, back to investors.
-
Strong Long-term Performance:
Australian PE/VC continues to demonstrate strong long-term net of fees
performance for investors, outpacing the ASX 300 and the ASX Small
Ordinaries for the 5, 10, and 20-year periods ending 31 December 2020 –
tracking between +1.5% and +10.9% ahead of the listed markets. Long-term
performance of the local market (over 20 years) remained ahead of global
peers, while mid-term performance (over 5 years) lagged.
-
PE/VC amid COVID-19:
Australian PE/VC performance held-up well for the year to date (as measured
through 31 December 2020), besting listed markets over this period. Among
global peers, Australian PE/VC was ahead of Developed Europe and Developed
Asia but lagged strong returns from US PE/VC, primarily due to a lower
relative allocation to Information Technology in the Australian PE/VC
market.
Industry Snapshot
The Australian PE/VC index represents a well-established asset class that
has invested significant capital for LPs and returned strong net
distributions. At the conclusion of Q4 2020, the Cambridge Associates
Australian PE/VC Index represented $30.3 billion raised by 109 PE/VC funds.
Over the 20-year period of data captured by the index, the industry has
invested $25.6 billion (+$1.6 billion in 2020) in Australian and New
Zealand companies, returning $29.2 billion (+$1.7 billion in 2020) net of
fees back to investors and holding unrealized investments valued at $11.2
billion (+$2.2 billion in 2020). The universe is historically dominated by
buyout and growth equity strategies, representing 93% of total
capitalization, while venture capital funds represent 7% of the index. In
2020, buyout and growth equity funds provided nearly 95% of the
distributions to investors, with venture capital representing close to 5%
of distributions. By net asset value as at 31 December 2020, buyout and
growth equity accounted for 77% of the index, with 23% in venture capital.
The Australian Private Credit market remains young relative to the US or Europe but has been developing well. Fundraising activities have increased in recent years, driven by the appetite from Australian businesses for bespoke financing solutions, especially within the middle market where the smaller cheque size and higher cost of business have historically been less appealing to traditional banking institutions.
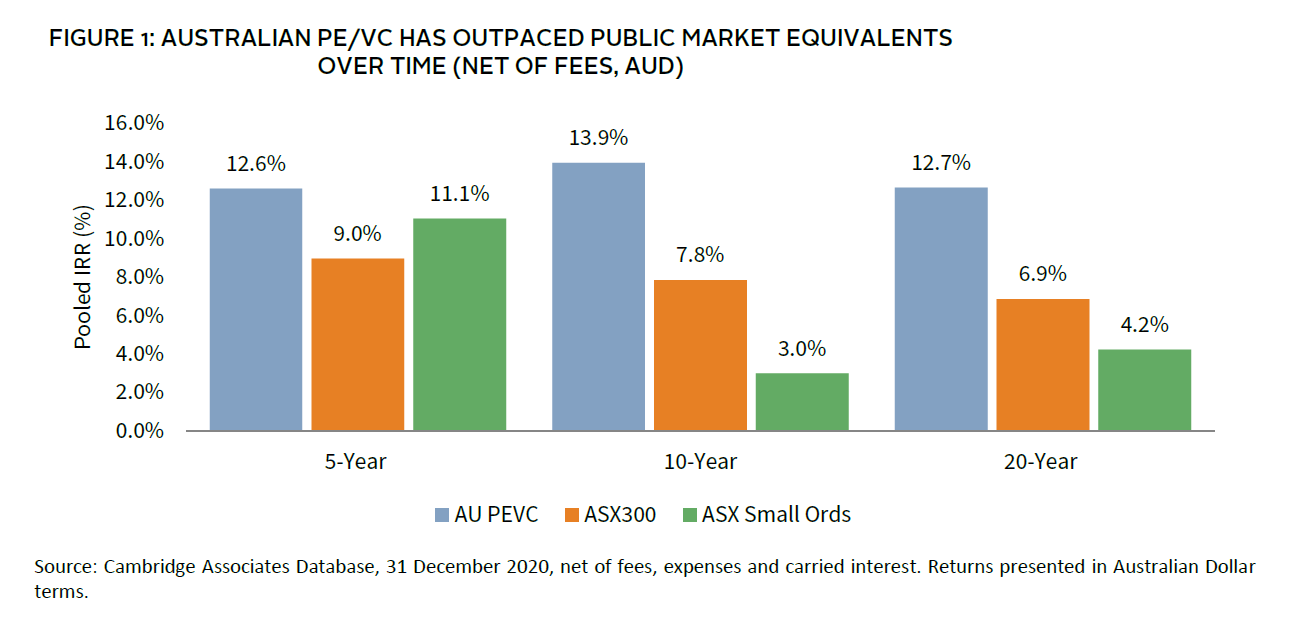
Long-Term Performance Remains Strong
Over the long term, Australian PE and VC returns showed continued strong
long-term performance, delivering double digit net of fees returns over 5-,
10-, and 20-year periods (Figure 1). Over these same periods, Australian
PE/VC managers in aggregate demonstrated robust outperformance over the
listed markets, outpacing the ASX 300 Index by +3.6% to +6.1% and the ASX
Small Ordinaries Index by +1.5% to +10.9% on a public market equivalent
(mPME) basis. To measure mPME, Cambridge Associates compared private equity
performance to that of listed equities by hypothetically ‘investing’ in the
ASX 300 and the ASX Small Ordinaries at the same time and equivalent amount
as the private equity investments. While it is generally accepted that the
higher risk and illiquidity of private equity require it to generate
returns of +3% to +5% over listed markets over time, the local PE and VC
index has largely achieved this standard hurdle across periods.
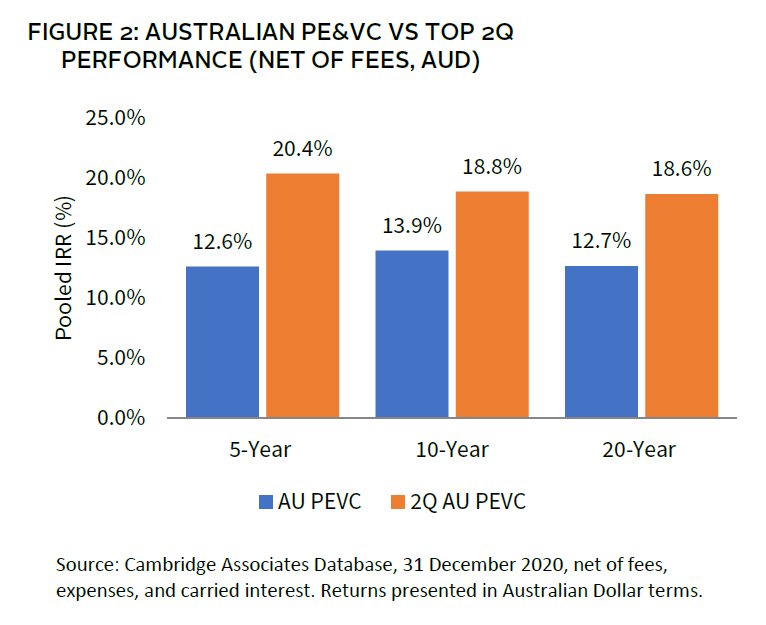
Manager selection and the ability to access top performing managers
provided higher absolute returns net of fees and relative to the listed
markets. In the data gathered by Cambridge Associates, the top two
quartiles of Australian PE/VC funds have delivered 18%+ annualized returns
over 5-, 10-, and 20-year periods ending 31 December 2020. This universe
exceeded returns of the broad Australian PE/VC industry by +4.9% to +7.8%
per annum over time, while also outperforming the ASX 300 Index by +11.0%
to +11.7% and the ASX Small Ordinaries Index by +9.3% to +15.8% on a public
market equivalent (mPME) basis.
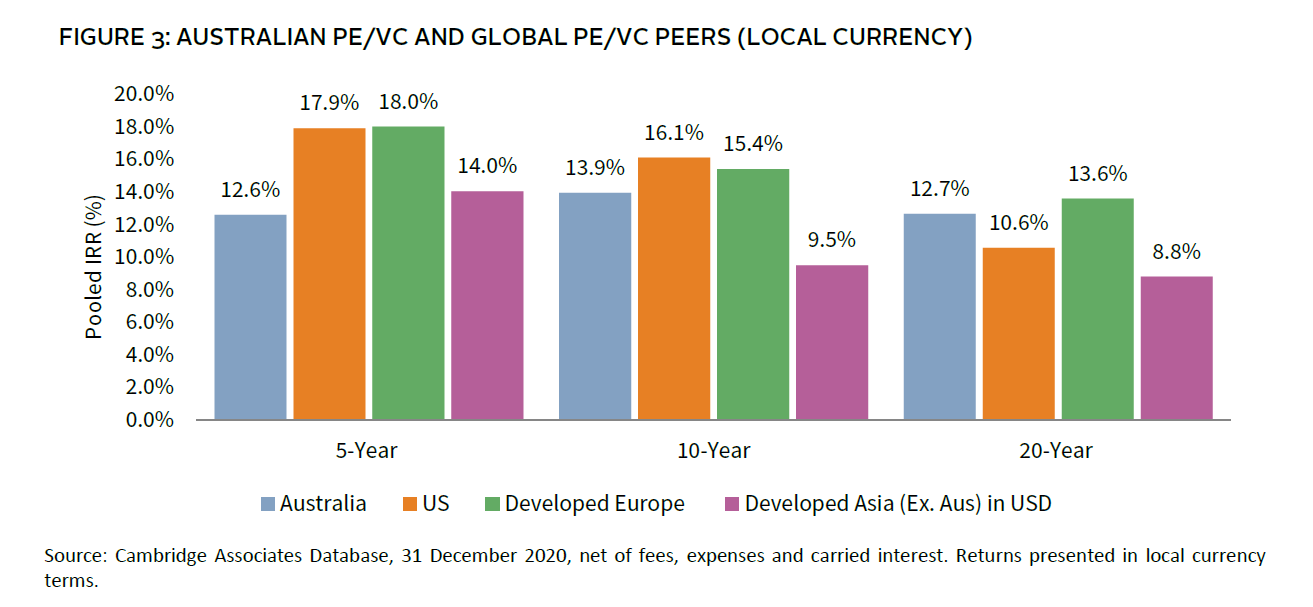
Australian PE/VC performance remains competitive among global peers over
time. On a local currency basis, with each region measured in its base
currency unless noted otherwise, Australian PE/VC returns exceeded US and
Asian PE/VC peers but lagged European PE/VC over the 20-year period (Figure
3). Over 5- and 10-year periods, Australian performance lagged global
PE/VC, reflecting local market factors including interest rates,
valuations, market depth and sector exposures.
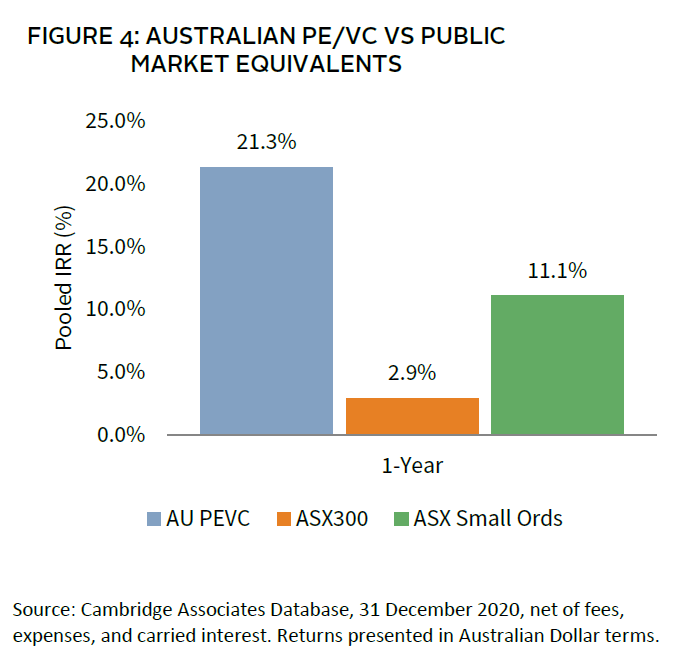
Australian PE/VC as COVID Continues
The Australian PE/VC Index was up 21.3% in 2020, outperforming the mPME of
public indices by +18.4% (ASX 300) and +10.2% (ASX Small Ords) for the
period (Figure 4). The fourth quarter (ending 31 December 2020) saw listed
markets recovered from their COVID19 losses in the prior quarters while the
strong performance of the Australian PE/VC index continued (+16.8%). The
compounding effect of lower mark-to-market downside from the PE/VC index
contributed to the aggregate outperformance versus listed peers for the
year. Public markets experienced a significant drawdown in 1Q but recovered
all losses in 4Q with major indexes up YTD for the first time in 2020.
Small caps experienced a stronger post-COVID recovery than their large-cap
counterparts.
While it is useful to measure the industry’s cash flows over a quarterly or
12-month period to provide a snapshot of the recent market volatility, this
periodicity does not provide a meaningful performance indicator for a
long-term asset class. Private equity and venture capital performance is
measured over the medium to long-term (5- to 20-year periods) to align
performance with the strategy of acquiring and divesting investment assets.
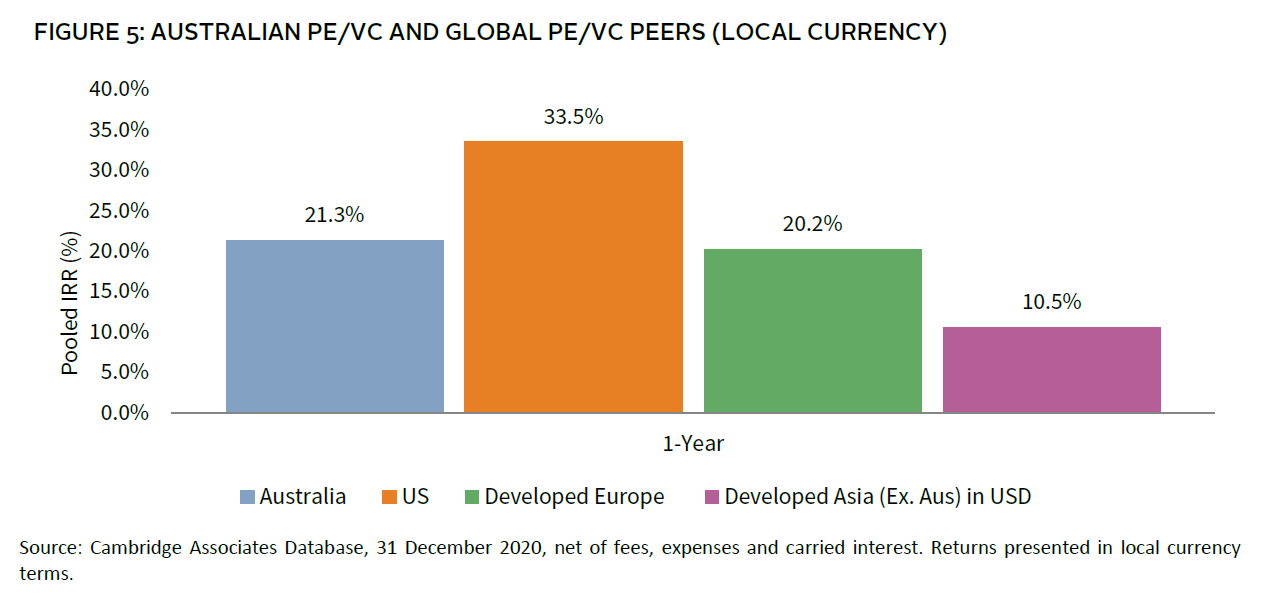
In line with global developed PE/VC peers, Australian PE/VC performance
remained robust throughout the year, though return dispersion across
regions contributed to varying results across regions for the period.
Strong performance from US PE/VC resulted in its outperformance versus
global peers (including Australia), in local currency terms (Figure 5).
Australian PE/VC bested European and Asian counterparts in 2020 showing the
relative strength of Australian businesses and economy, largely due to the
milder pandemic impact experienced. For the 1-year period, Australian PE/VC
had meaningfully lower allocations to Information Technology relative to
the US which benefitted from the sector’s strong performance.
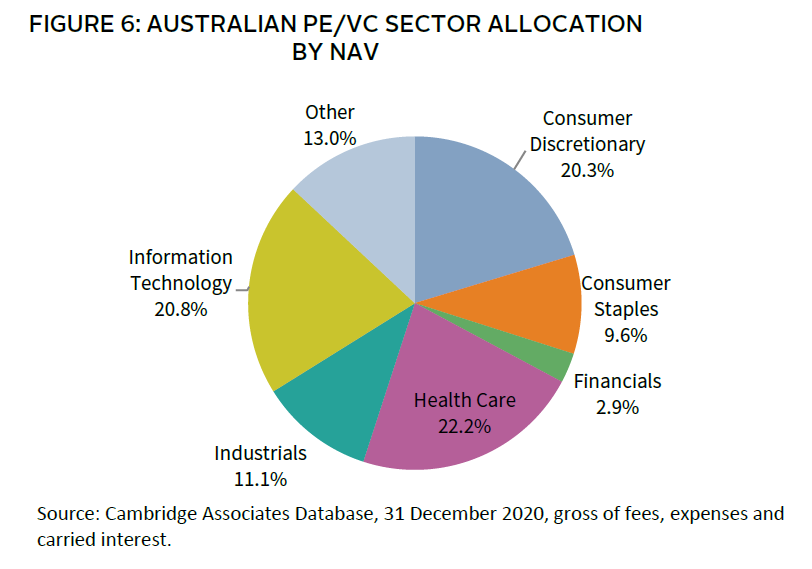
As of 31 December 2020, the Australian PE/VC index continued to be
dominated by four key sectors: Consumer, Healthcare, IT and Industrials
(Figure 6). In 2020, the Australian PE/VC Index invested capital into
Industrials, Communication Services, Healthcare, Consumer and IT companies
and realizations came from companies in the Industrials, Healthcare and
Consumer sectors.
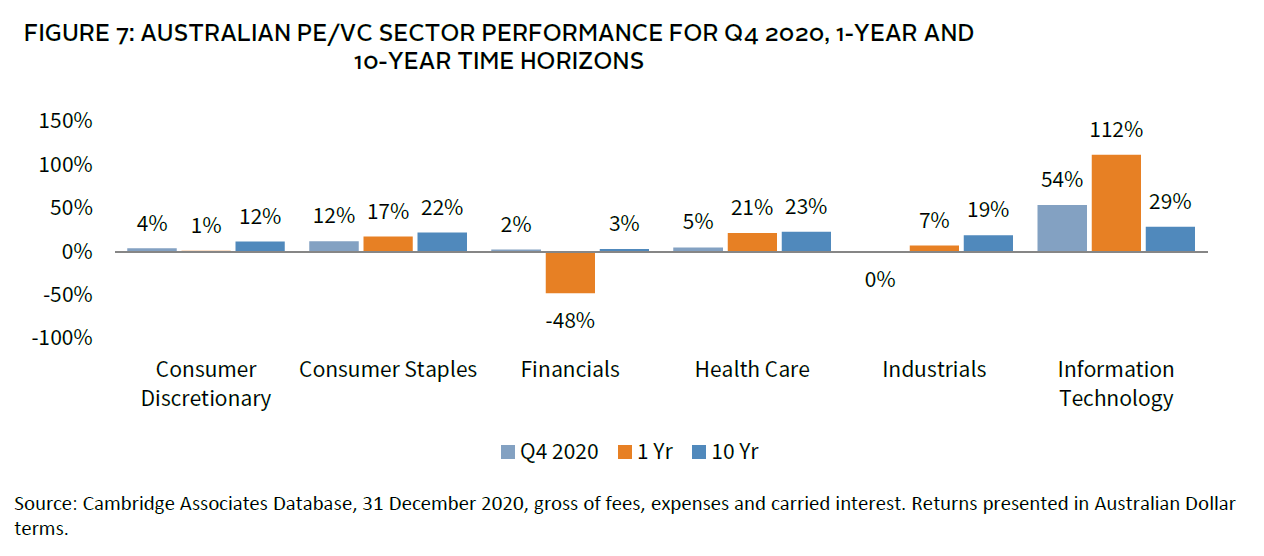
Australian PE/VC Index sector “winners” following the COVID19 pandemic
included: IT, Consumer Staples and Healthcare (Figure 7), which all
contributed positive returns for the full year. The Consumer Discretionary
and Financials sectors detracted during the height of the crisis, however
the Consumer Discretionary sector recovered meaningfully in the second half
of the year to finish with a 1% return. Global PE/VC peers saw similar
“winners” in offshore markets during this period, including positive
contributions from IT, Healthcare, Industrials and Consumer Staples. While
this year-to-date view provides a reference to PE/VC performance during the
pandemic, it is a very short time frame of data for strategies that
typically manage investments with a three- to seven-year holding period.
Australian PE/VC Looking Ahead
Broadly, Australian PE/VC navigated the COVID19 pandemic well. During the
onset of the pandemic, PE and VC managers were quick to respond,
intensively and actively working with their portfolio companies to dampen
the initial impacts of the global pandemic and access available support
from governments and banks. While certain sectors were more affected by the
crisis (e.g. retail and tourism), overall, the net impact of these
industries were more than offset by stronger performance in sectors that
benefitted from the pandemic, such as IT and Healthcare. Looking ahead, as
the broader macro landscape continues to improve, supported by fiscal and
monetary stimulus, market liquidity, improved consumer and business
confidence, as well as pent-up demand, the Australian PE/VC industry is
well-positioned to meet return expectations, especially relative to listed
assets where valuations have increased considerably. As additional data
builds via the Australian PE/VC Index, Cambridge Associates will continue
to measure the PE/VC industry and reflect on the impacts to valuation,
distributions and investments in Australia and New Zealand.